SEN - 3 & 4 Year Old Extended Entitlement
The table below shows the number and percentage of children accessing the extended 30 hour entitlement who are receiving SEN support.
|
2019 |
2020 |
2021 |
2022 |
2023 |
2024 |
|
|---|---|---|---|---|---|---|
| EHC Plans - Number of children |
3 |
3 |
5 |
9 |
10 |
4 |
| EHC Plans - % of total funded children |
0.2% |
0.2% |
0.3% |
0.5% |
0.5% |
0.02% |
| SEN Support – Number of children |
41 |
44 |
31 |
49 |
57 |
85 |
| SEN Support – % of total funded children |
2.7% |
2.8% |
2.1% |
3.0% |
3.1% |
0.5% |
| All SEN Children - Number |
44 |
47 |
36 |
58 |
67 |
89 |
| All SEN Children |
2.9% |
3.0% |
2.4% |
3.5% |
3.7% |
5.3% |
The number of children receiving special educational needs support to access their extended 30 hour entitlement increased from 58 in 2022 to 89 in 2024. The number of children accessing their entitlement with an EHC Plan decreased from 10 in 2023 to 4 in 2024.
The table below shows the proportion of children taking up their extended entitlement who receive SEND support in North Tyneside, compared to the national average.
|
North Tyneside |
England |
||||||||
|---|---|---|---|---|---|---|---|---|---|
| Extended Entitlement 3 & 4 Year Olds: |
2022 |
2023 |
2024 |
2022 |
2023 |
2024 |
|||
| with EHC Plans - % of total funded children |
0.5% |
0.5% |
0.2% |
0.4% |
0.6% |
0.7% |
|||
| with SEN Support – % of total funded children |
3.0% |
3.1% |
5.1% |
2.9% |
3.6% |
3.9% |
|||
| with any SEN as % of total funded children |
3.5% |
3.7% |
5.3% |
3.3% |
4.1% |
4.5% |
|||
The proportion of children accessing their extended entitlement with any SEN is higher than the national average.
Extended 3 and 4 Year Old Entitlement Uptake by Ethnicity
The table below shows the ethnicity of children taking up their extended 3 and 4 year old entitlement.
| Number of Extended 3&4 Year olds 2024 | Percentage of Extended 3&4 Year olds 2024 | |
|---|---|---|
| Asian / Asian British |
37 |
2.20% |
| Black/African/Caribbean/Black British |
15 |
0.90% |
| Mixed / Multiple Ethnic Groups |
56 |
3.40% |
| White |
1528 |
92% |
| Other ethnic group |
8 |
0.50% |
| Refused / not obtained |
23 |
1.40% |
| Total Children |
1667 |
Most children accessing their extended entitlement are classed as ‘white’ under the 2024 census information.
3 and 4 Year Old Extended Entitlement – Percentage Take up by Provider
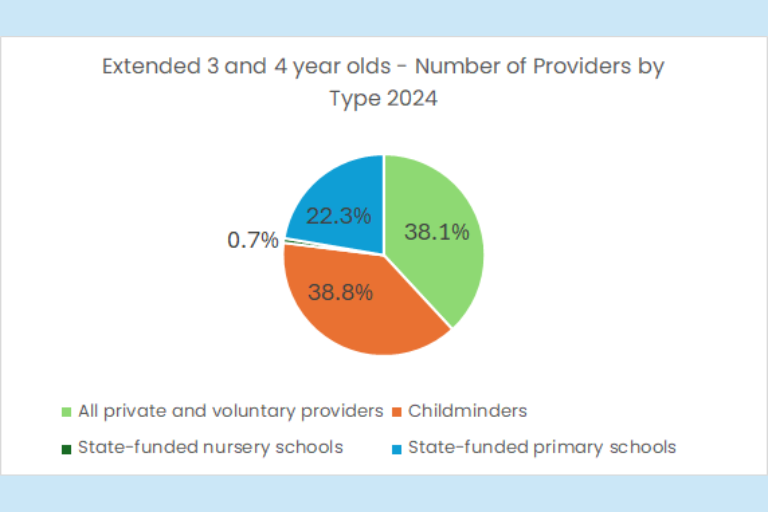
Extended places are delivered across a range of provider types, the graph below shows the proportion of providers delivering extended 3 & 4 year old entitlement places by provider type.

The majority of providers delivering extended 3 & 4 year old entitlement places are childminders or private and voluntary sector entities. North Tyneside also has a significant school based offer
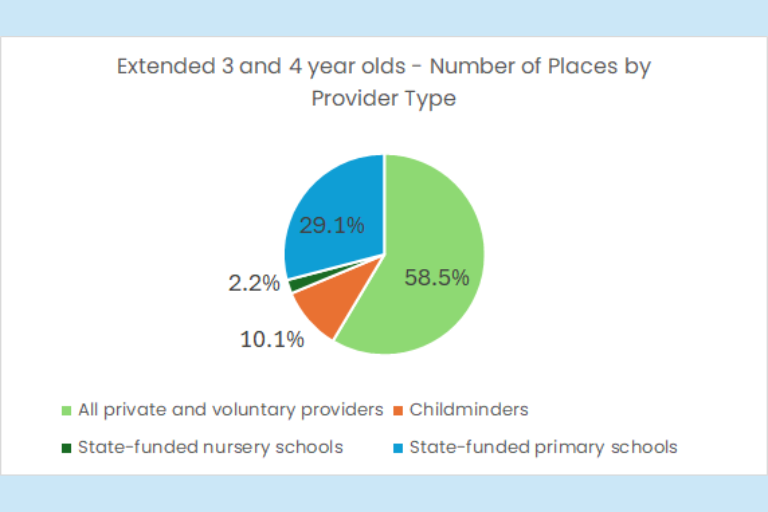
The chart below shows the number of extended entitlement places for 3 & 4 year olds by provider type, based on the January 2024 censuses.

Most extended entitlement places for 3 & 4 year olds are delivered in the private and voluntary childcare sector. Schools deliver a significant minority of places.
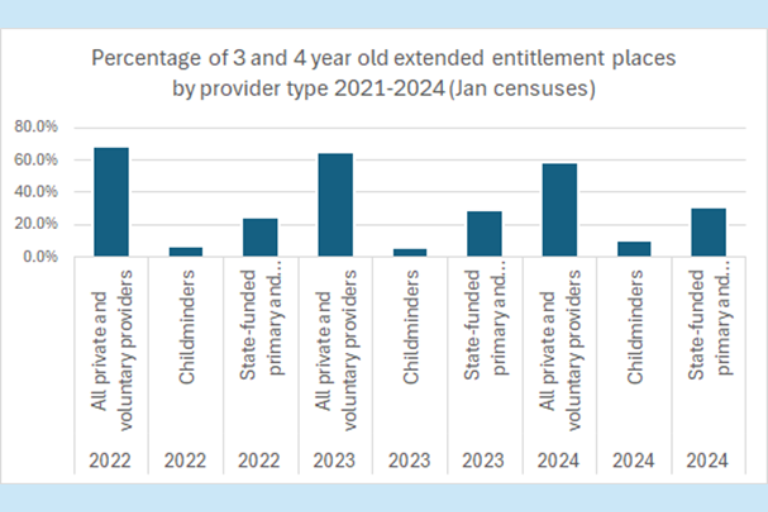
The chart below shows that the proportion of places delivered in private, voluntary and independent settings has reduced over the past 3 years, with a corresponding growth in the proportion of places delivered by maintained nursery schools and state funded schools and Childminders. This reflects an increase in the number of schools delivering a 30 hour offer.

