Level of need
Within North Tyneside rates of adult (18+ years) overweight and obesity are 70.7%, higher than that of the England average of 63.8%. This equates to nearly three out of four adults being either overweight or obese in North Tyneside (approximately 118,300 adults).
NCMP measurements for North Tyneside children (2022-2023) showed that 22.1% of reception pupils (1 in 5), and 36.1% of year 6 pupils (more than 1 in 3) were classed as overweight or obese. This compares with national figures of 21.3% and 36.6% respectively. North Tyneside rates are higher than the national average for Reception, but lower for Year 6. These figures equate to approximately 1,250 reception children and approximately 1,850 year 6 children being overweight or obese.
For adults, rates of overweight and obesity have increased year on year since 2016-17. Although rates for Year 6 children fell from the high of 2021-22, they remain higher they were 10 years ago. Currently Reception rates are at a 10 year low, but have fluctuated around the 25% rate for over 10 years.
Deprivation
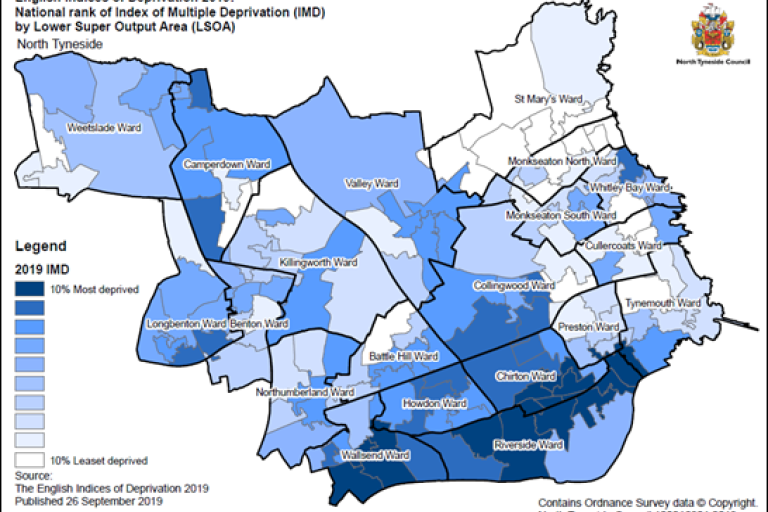
The relationship between deprivation and obesity is well documented. Map 1. below shows the 2019 Index of Multiple Deprivation mapped to North Tyneside, with the darker colours representing the most deprived areas, and the lighter colours representing the least deprived areas.
Map 1. 2019 Index of Multiple Deprivation

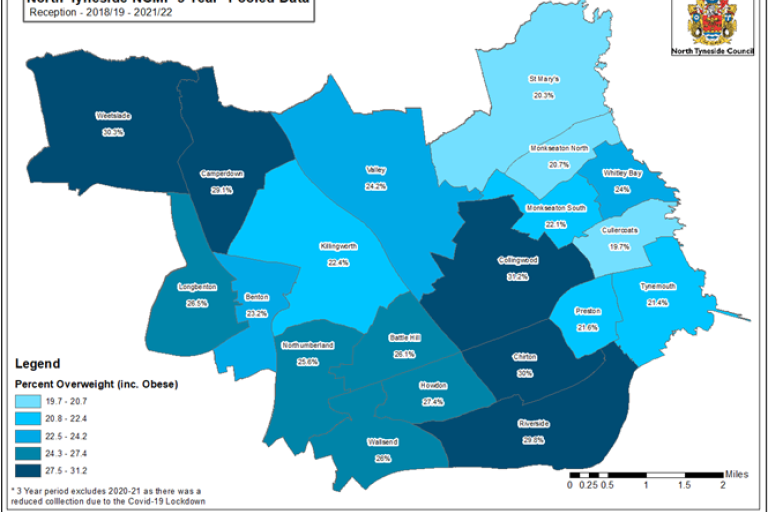
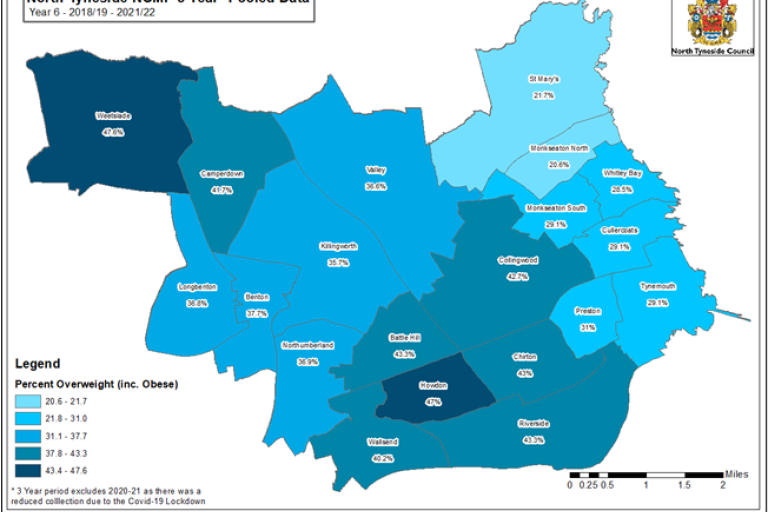
Map 2. and Map 3. show rates of overweight and obesity for Reception and Year 6 children, combined across a 3-year period (2018-2022 – 2020-21 data is excluded due to Covid 19 restrictions). The most deprived wards (e.g., Riverside, Chirton, Howdon) are among those with the highest rates of childhood overweight and obesity. Conversely, the least deprived wards in the borough (e.g., St Mary’s, Monkseaton North) are among those with the lowest rates of childhood overweight and obesity.
Map 2. Reception: Prevalence of overweight (including obesity) 3-years data combined 2018-2022

Map 3. Year 6: Prevalence of overweight (including obesity) 3-years data combined 2018-2022

Ethnicity
People of Black, Asian, and other ethnic minority backgrounds are at an equivalent risk of diabetes and other health conditions or mortality due to excess weight at a lower BMI than White populations. Although local level data is not available on rates of overweight and obesity within ethnic groups across North Tyneside, it is reasonable to assume that prevalence rates in North Tyneside will mirror those seen nationally. It is possible to extrapolate approximate figures within North Tyneside based on current population estimates and national prevalence rates (Table 3).
| Ethnic category | Population % of North Tyneside | Approx. number of adults | National prevalence % rates | Approx. number of adults classified as overweight or obese |
|---|---|---|---|---|
| White Other 2 | 1.5% | 2,509 | 59.1% | 1,482 |
| Asian | 1.9% | 3,178 | 57.6% | 1,830 |
| Mixed | 0.9% | 1,505 | 60.1% | 904 |
| Black | 0.4% | 669 | 70.8% | 473 |
Total population of adults in North Tyneside = 167,310
Learning Disabilities (LD)
Within North Tyneside 22% of the LD population are overweight and a further 35% are obese, giving a total of 57% (almost 2 in 3). More severe health risks are seen in a person with obesity (or severe obesity) versus a person who is classified as overweight.
