Level of Need
Data from the 2020 dental survey for 3 years olds was impacted by COVID19, with small sample sizes for North Tyneside as well as other local authorities. Results are unlikely to truly reflect the oral health of 3-year-olds in the region and as such we have used the results of the 2013 3-year-old dental survey data.
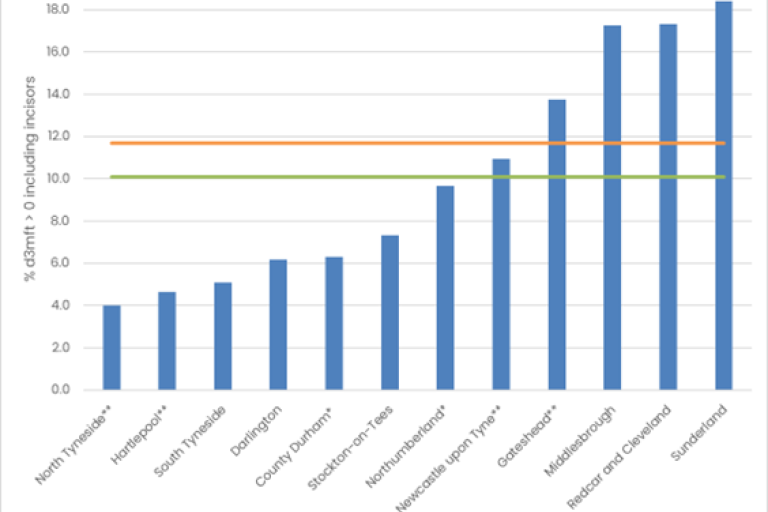
Percentage of decay in 3-year-olds (2013): There is significant variation in decay rates across the North East. North Tyneside’s rate of decay in 3-year olds was the lowest in the region with rates far below both regional and national average.
Figure 2 Percentage of 3-year-olds with any decay experience (% d3mft>0 incl Incisors) 2013, National Dental Epidemiology Programme for England
*partly fluoridated **fully fluoridated
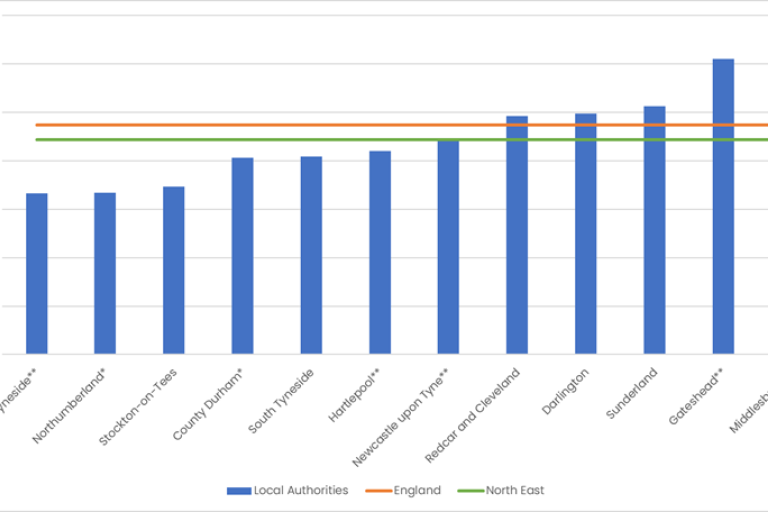
Percentage of decay in 5-year-olds (2022): North Tyneside has the lowest average decay levels in 5 years olds in the North East at 16.6%. This is below both the regional and national average.
Figure 3 Percentage of 5-year-olds with any decay experience (% d3mft > 0) 2022, National Dental Epidemiology Programme for England
*partly fluoridated **fully fluoridated
For most local authorities decay increases substantially between 3 and 5 years old. This is due to the time it takes for the decay process to progress to the stage of requiring tooth extraction, usually around 18 months. This highlights the importance of preventative work to reverse the early effects of dental decay.
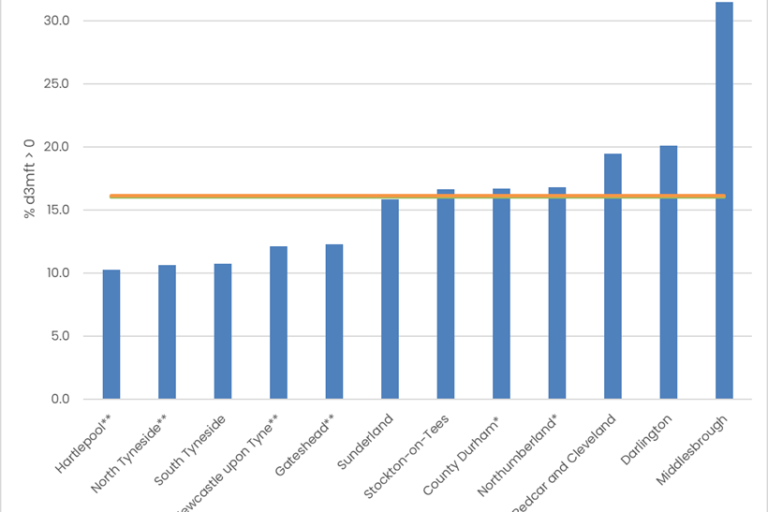
Percentage of decay in children in Year 6 2023: North Tyneside has one of the lowest levels of tooth decay in Year 6 children in the North East as shown below.9 This is below both regional and national average.
Figure 4 Percentage of Year 6 children with any decay experience (% d3mft>0) 2023, National Dental Epidemiology Programme for England
*partly fluoridated **fully fluoridated
Oral health survey of Year 6 Children, OHID
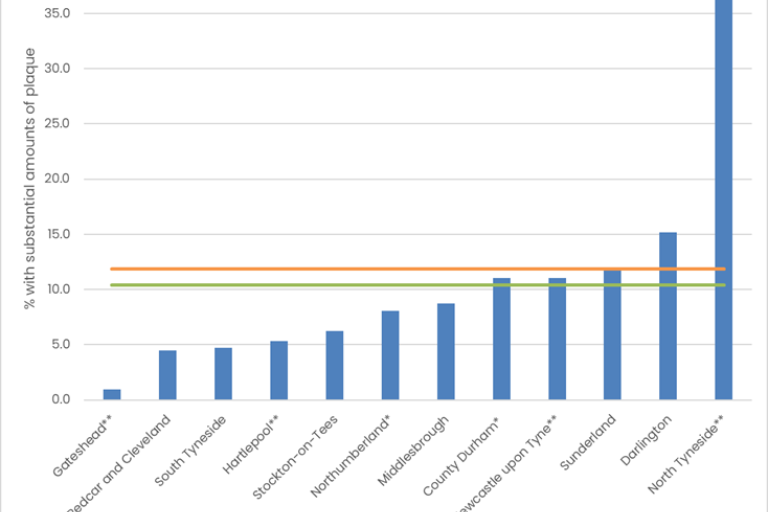
For those experiencing tooth decay in North Tyneside they are more likely to suffer advanced decay as compared to regional neighbours. The percentage of children with advanced decay and substantial amounts of plaque detected were some of the highest in the region and above national average as shown in Figure 5.
Figure 5 Percentage of Year 6 children with substantial amounts of plaque 2023, National Dental Epidemiology Programme for England
*partly fluoridated **fully fluoridated
Tooth extractions in hospital for 0-to 19-year-olds: Tooth extractions are usually the result of severe decay. The rate of tooth extraction in 0–19- year-olds per 100,000 population is higher in North Tyneside as compared to the national average of 751.9 per 100,000 in 0–19-yearolds locally as compared to 360.4 per 100,000 nationally.10 North Tyneside’s rate for 0–19-year-olds per 100,000 population is the second highest in the North East. The highest tooth extraction rates in North Tyneside are for 6–10-year-olds.10 This is the same trend that is seen nationally.
Figure 6 Tooth extractions in hospital 0–19-year-olds 2023, OHID
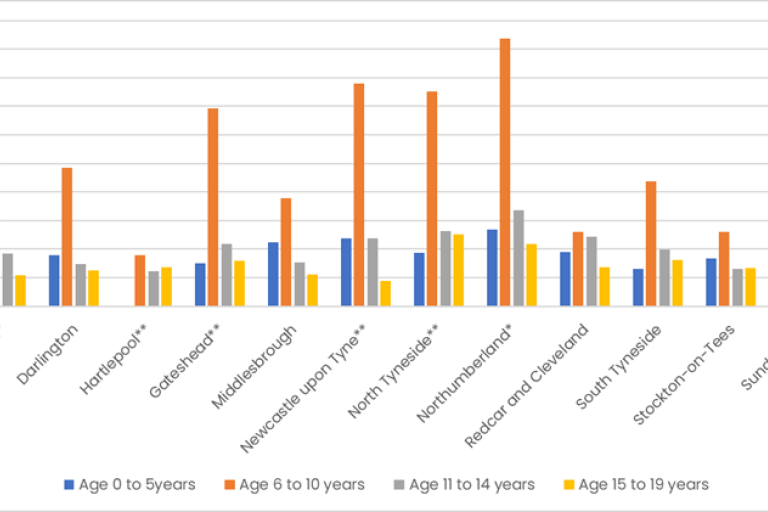
*partly fluoridated **fully fluoridated
Child and Maternal Health - OHID
Oral health in adults
The adult oral health survey 2021 reports that 66% of English adults selfreported very good or good oral health, 7% reported bad or very bad oral health.
A recent survey of English adults attending dental practices showed that 27% of participants had untreated tooth decay. This was more prevalent in participants aged 25-34 years old, those living in more deprived areas and those who had not attended a dentist in ≥2 years. Unfortunately the sample size from North Tyneside was too small for local analysis.
In 2020 Public Health England reported on oral cancer incidence, survival and mortality in England. The North East average is above the national for both incidence and mortality. North Tyneside is above the national average but below the regional average for both incidence, at 15.06 per 100,000, and mortality, at 4.38 per 100,000.
| Area | Standardised incidence per 100,000 | Standardised mortality per 100,000 |
|---|---|---|
| England | 14.55 | 4.54 |
| North East Region | 16.88 | 5.45 |
| County Durham | 15.83 | 5.38 |
| Darlington | 14.93 | 7.10 |
| Gateshead | 15.96 | 4.06 |
| Hartlepool | 14.56 | 6.86 |
| Middlesbrough | 16.87 | 4.35 |
| Newcastle | 21.05 | 6.08 |
| North Tyneside | 15.06 | 4.38 |
| Northumberland | 15.30 | 4.74 |
| Redcar and Cleveland | 14.48 | 4.59 |
| Sunderland | 18.57 | 6.44 |
| South Tyneside | 22.50 | 5.83 |
| Stockton-on-Tees | 18.43 | 7.35 |
Oral cancer in England, Public Health England
Oral health in older adults
42,897 of North Tyneside residents were recorded as ≥65 years old in the last census. The oral health of older people in England has improved since the 1960’s with more adults keeping their teeth into old age. However, many will have dental restorations such as fillings which require ongoing oral care.
North Tyneside has a larger population in residential homes than the national average. In 2015 Public Health England published a review of oral health surveys of older people predominantly based on older people living in residential and nursing care homes in England. The survey found:
Untreated tooth decay is higher in the household resident elderly population than in the general adult population. Older adults living in care homes have an even higher decay prevalence, with most dentate residents having active decay
- Care home managers experience much more difficulty in accessing dental care for their residents than older adults living in their own homes.
- Approximately half of residents in care homes would find it difficult or impossible to receive urgent treatment in a general dental practice due to medical or psychological complications.
- Little is known about access to services for the increasing numbers and proportions of older people receiving ‘care in your home’ services.
- Multimorbidity and polypharmacy makes the oral health care of older adults more challenging.
A 2016 survey of mildly dependant older people showed that 10.3% of North Tyneside’s sample reported oral health impacts fairly or very often, as compared to the national average of 17.7%. However 39.7% of the sample were edentulous (lacking teeth) as compared to the national average of 27.0%, and 36.2% reported not having seen dentist within the last 2 years, above the national average of 34%.
Dental access in North Tyneside
Although primary care dental services are not provided through the local authority public health team it is important to acknowledge their impact on local population oral health.
NHS England provides data on local authority NHS dental access, local data is shown in Table 3. Dental activity has not returned to prepandemic levels nationally. North Tyneside level of activity is just below the regional in both adults and children.
| Local Authority | 2020 % adults seen | 2023 % adults seen | 2020 % children seen | 2023 % children seen |
|---|---|---|---|---|
| North East Region | 56.2 | 46.3 | 61.1 | 56.4 |
| County Durham | 50.5 | 41.0 | 54.0 | 48.8 |
| Darlington | 56.6 | 45.9 | 64.0 | 55.0 |
| Gateshead | 57.8 | 54.7 | 64.9 | 63.7 |
| Hartlepool | 51.6 | 43.4 | 54.2 | 51.4 |
| Middlesbrough | 63.4 | 40.7 | 67.8 | 50.7 |
| Newcastle | 57.4 | 46.9 | 65.0 | 57.1 |
| North Tyneside | 55.0 | 44.1 | 60.1 | 55.6 |
| Northumberland | 54.8 | 45.7 | 63.1 | 55.9 |
| Redcar and Cleveland | 61.1 | 65.8 | 61.9 | 74.3 |
| Sunderland | 59.3 | 42.2 | 61.6 | 42.8 |
| South Tyneside | 63.8 | 60.8 | 62.9 | 64.1 |
| Stockton-on-Tees | 54.8 | 49.7 | 63.6 | 58.3 |
NHS Dental Statistics for England, 2022-23, Annual Report - NHS Digital
Healthwatch North Tyneside conducted community engagement to elicit local community and professional views on dentistry access. Key findings were: findings a dentist is difficult, getting appointments was difficult, there was a mismatch between patient and professional definitions of ‘urgent’, cost was a barrier, there is a lack of understanding on NHS dentistry organisation. A number of recommendations are made in the report.
Oral health risk factors in North Tyneside
Toothbrushing: In 2009 data 75% of adults cleaned their teeth at least twice a day and a further 23% once a day, the majority used a high fluoride level toothpaste. Despite the majority reporting regular toothbrushing 66% of adults had plaque on at least one tooth.
The 2013 Children’s Dental Health Survey reported that 77% of 12-yearolds and 81% of 15-year-olds brushed their teeth at least twice a day in England. Rates were higher in females and those eligible for free school meals. Parental reporting of tooth brushing in 5 and 8 year olds showed slightly higher rates of brushing at least twice a day. Rates had improved as compared to 2003, however relatively modestly.
Smoking: Smoking prevalence has been falling in adults over recent years nationally. This same trend has been seen in North Tyneside.
Alcohol: North Tyneside has the fourth highest admissions episodes for alcohol-related conditions in adults across England at 819 per 100,000 population. The national average is 494 per 100,000. Within the 10 local authorities with the highest alcohol related admissions are within the North East.
Diabetes: The estimated prevalence of diabetes in North Tyneside in adults is 8%. This is higher than the national average of 7.3% but the same as the regional average. Prevalence has been rising year on year nationally and North Tyneside shows the same trend.
Breastfeeding: in 2020/21 62.8% of North Tyneside babies’ first feed was breastmilk, this is below the national average of 71.7%. An important marker of breastfeeding success if the number breastfeeding at 6-8 weeks after birth, North Tyneside’s numbers have improved over time and are the second highest in the region, however they still lag behind the national average.
