Additional data on prevalence and level of need
The table below shows the most recent published data for North Tyneside, the North East and England, and it shows that generally MSK health in North Tyneside is worse than England overall, but generally not worse than most other local authorities in the North East (apart from osteoporosis, where the rates were the joint highest in the region). However, some of these indicators have not been updated since 2012, as shown below.
Figure 7 - Prevalence of key MSK conditions in North Tyneside
| North Tyneside | North East | England | |
|---|---|---|---|
| Back pain prevalence, all ages, 2012 | 18.1% | 18.0% | 16.9% |
| Percentage with long term back problems, age 18+, 2016/17 | 10.2% | 11.3% | 9.4% |
| Percentage with arthritis or long-term joint problems, 2016/17 | 15.8% | 16.0% | 12.2% |
| Hip osteoarthritis prevalence, age 45+, 2012 | 10.9% | 11.3% | 10.9% |
| Knee osteoarthritis prevalence, age 45+, 2012 | 18.5% | 19.2% | 18.2% |
| Rheumatoid arthritis prevalence, age 16+, 2022/23 | 0.9% | 0.9% | 0.8% |
| Rate of hip fractures, age 65+, 2021/22 | 636 per 100,000 | 612 per 100,000 | 551 per 100,000 |
| Prevalence of osteoporosis, age 50+, 2022/23 | 1.3% | 0.9% | 1.0% |
Some indicators allow comparison within the Borough and therefore show differences in need. GP profiles shows MSK data at GP level, people registered with GP practices in North West Primary Care Network (PCN) were more likely to report a long-term MSK problem (“arthritis or ongoing problem with back or joints”) than Wallsend, but there was large variation by practice too. The table below shows some of the known variation by condition.
Figure 8 - Variation in MSK conditions within North Tyneside
| MSK Condition | Variation within North Tyneside |
|---|---|
| Back pain (2012) | In 2012 the prevalence was highest in Weetslade ward and lowest in Wallsend |
| Osteoporosis (2022/23) | In 2022/23 People registered with GP practices in Wallsend were more likely to have osteoporosis than people registered with practices in Whitley Bay. In fact, Wallsend Primary Care Network (PCN) had the 2nd highest prevalence of osteoporosis of all PCNs in the North East and North Cumbria |
| Rheumatoid arthritis (2022/23) | Less variation at PCN-level, but some by GP practice. Prevalence lowest for patients registered at Beaumont Park Surgery and highest at Spring Terrace Health Centre. However, due to the small numbers involved there was a difference of less than 30 patients between the two practices. |
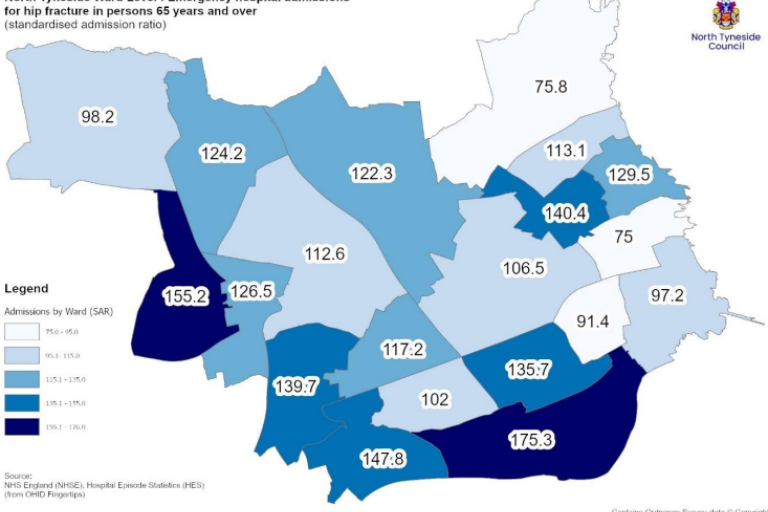
| Hip fractures (2016/17 to 2020/21) | From 2016/17 to 2020/21, people aged 65+ were more likely to have an emergency admission for a hip fracture in North Tyneside than England overall. However, admission rates were lower in some wards than England. Rates were lowest in Cullercoats and highest in Riverside ward. Figure 5 below shows this in more detail, where values over 100 represent higher admission ratios than England |
The map below shows the variation in hospital admissions across North Tyneside from 2016 to 2021
Figure 9 – comparison of hip fracture admission rations ward, 2016-2021

